

Ask questions about your Buildkite data
Connect Buildkite to Filament and turn your data into instant reports and dashboards. No spreadsheets. No setup. Just ask questions and get answers.
Buildkite tracks your builds and pipelines, but understanding how CI/CD performance affects product velocity, incident rates, or deployment success means connecting to your project management and monitoring tools. Filament links your Buildkite data to other platforms and answers questions about build patterns, team productivity, and deployment frequency in plain English.
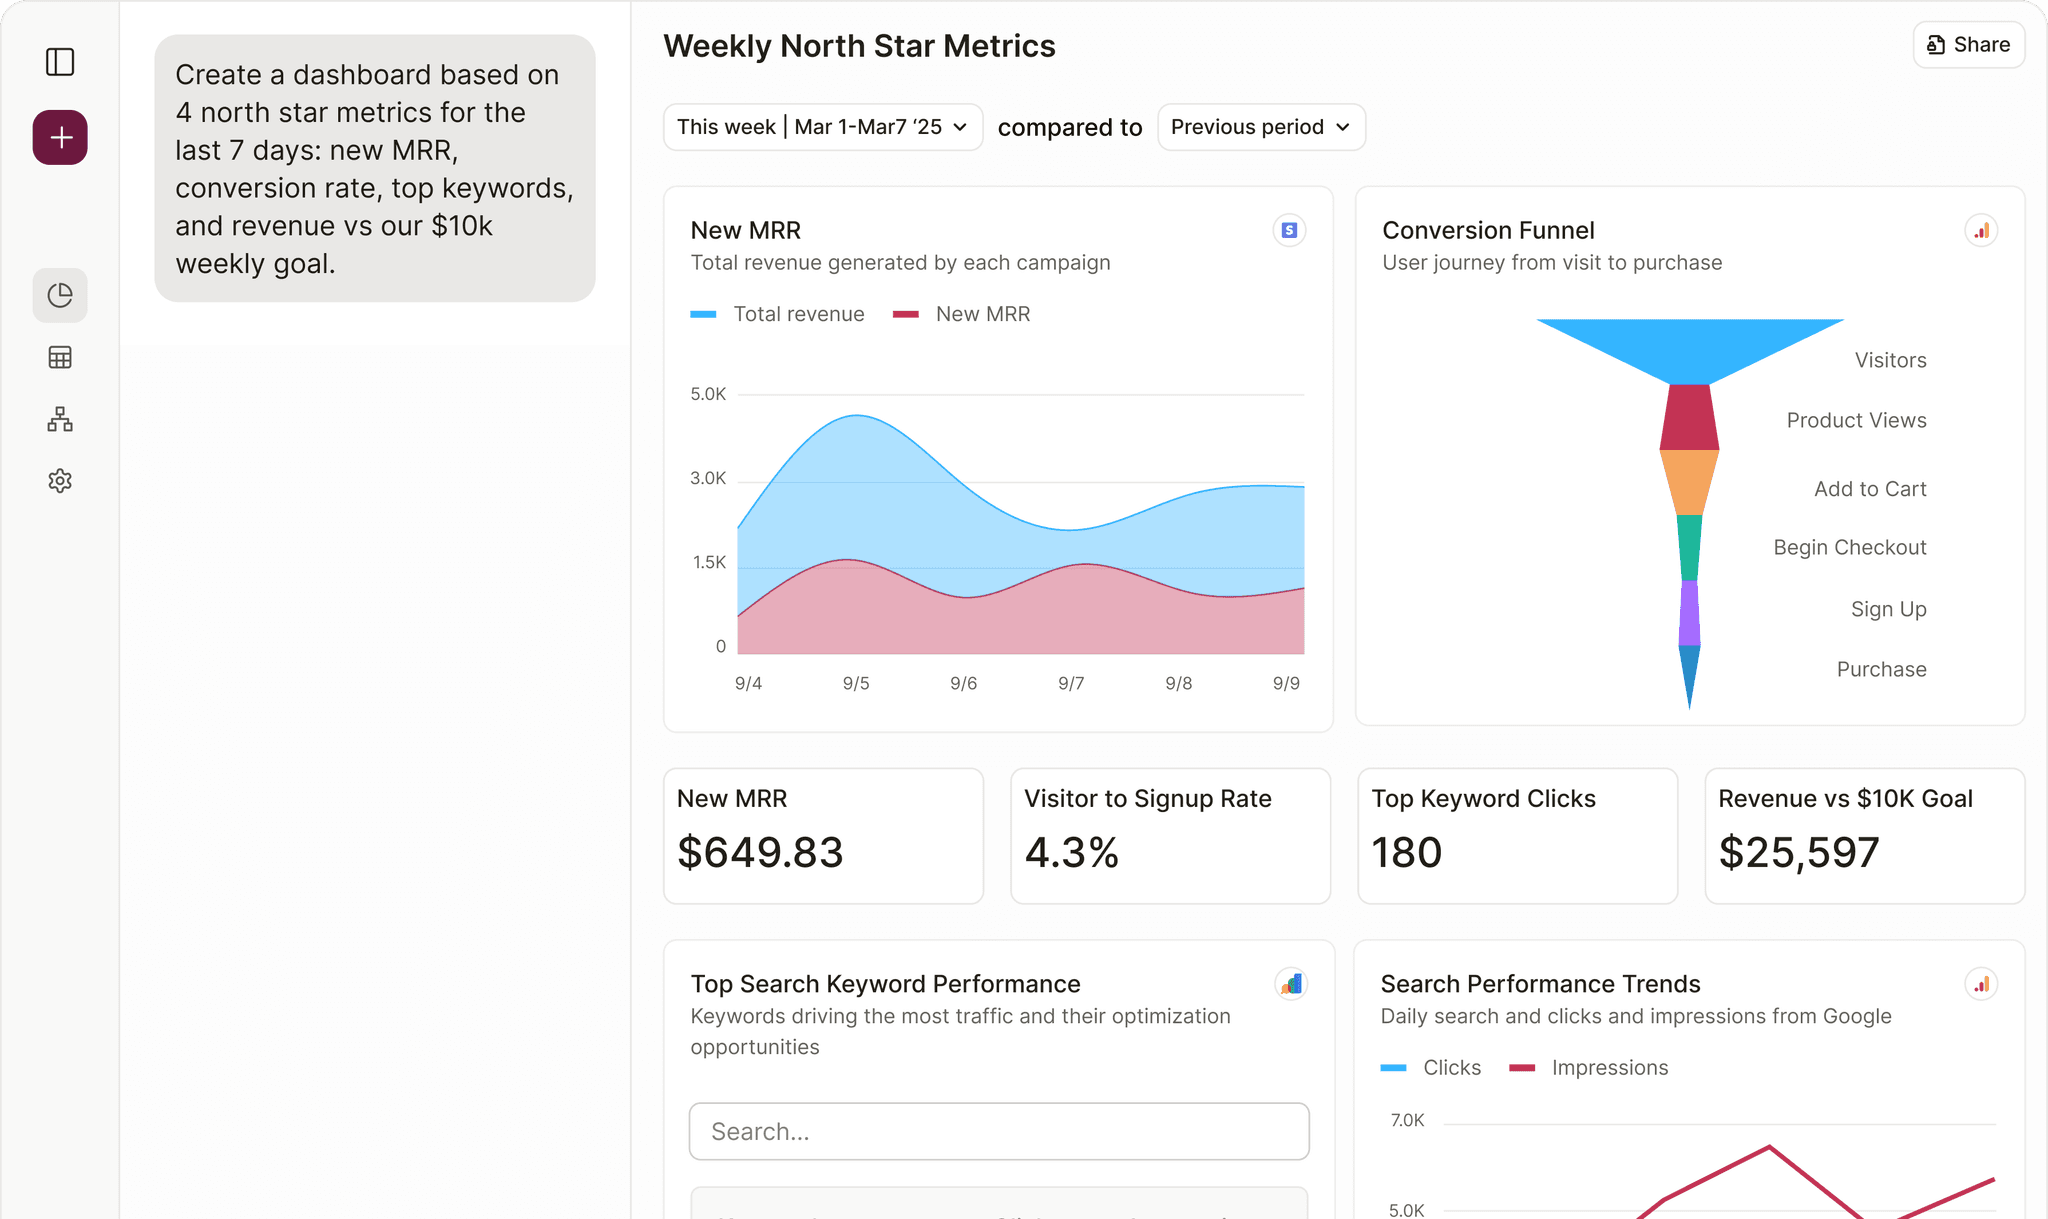
Track Buildkite KPIs with Filament Analytics
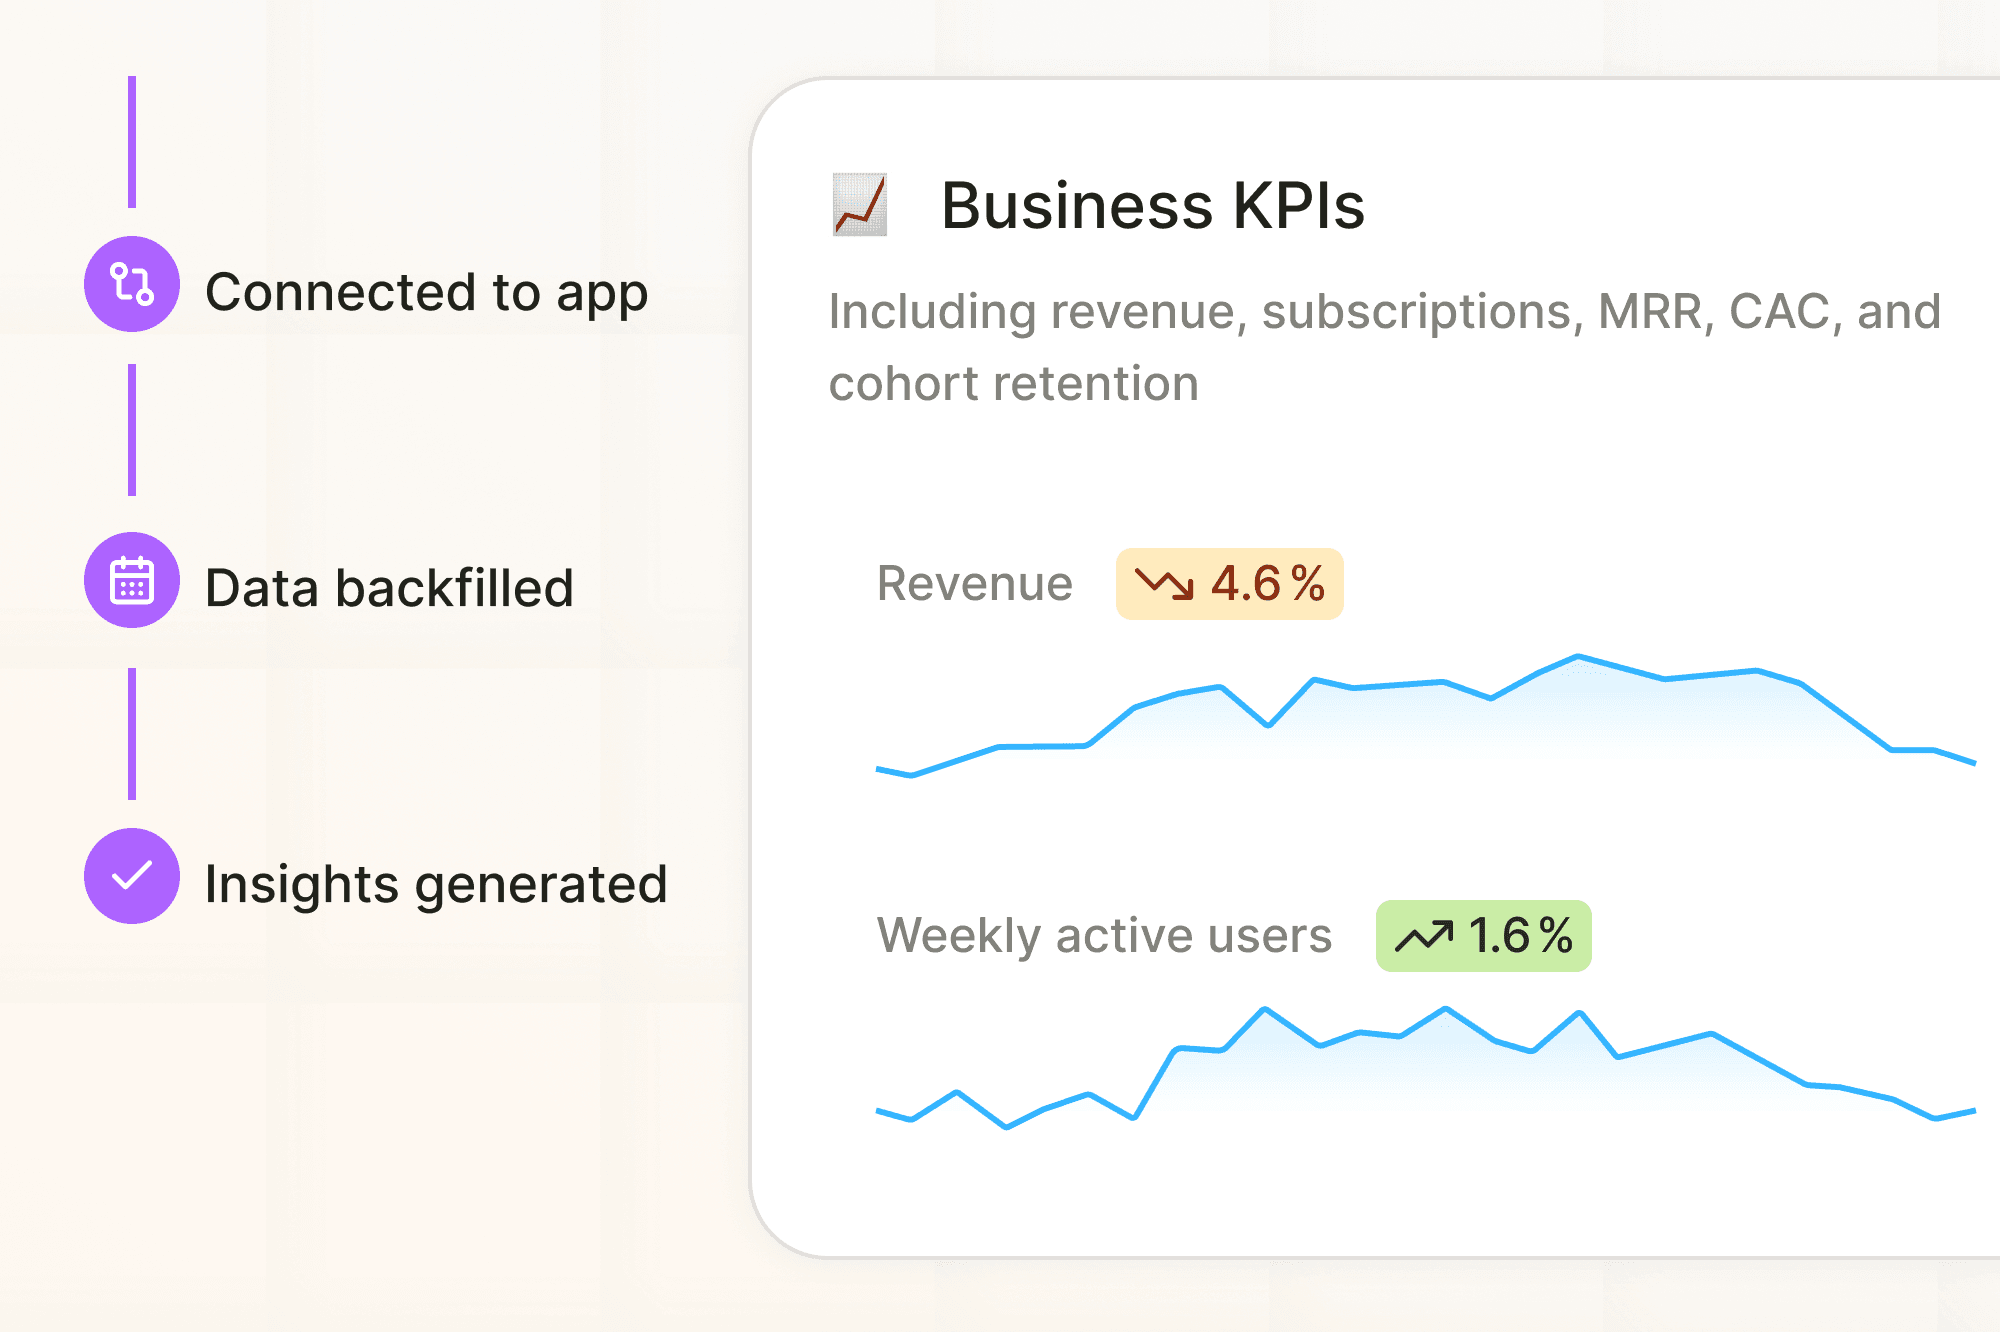
Connect your Buildkite account to Filament and instantly track your most important KPIs. All in plain English dashboards that update automatically.
View documentationKey Buildkite metrics you can track in Filament:
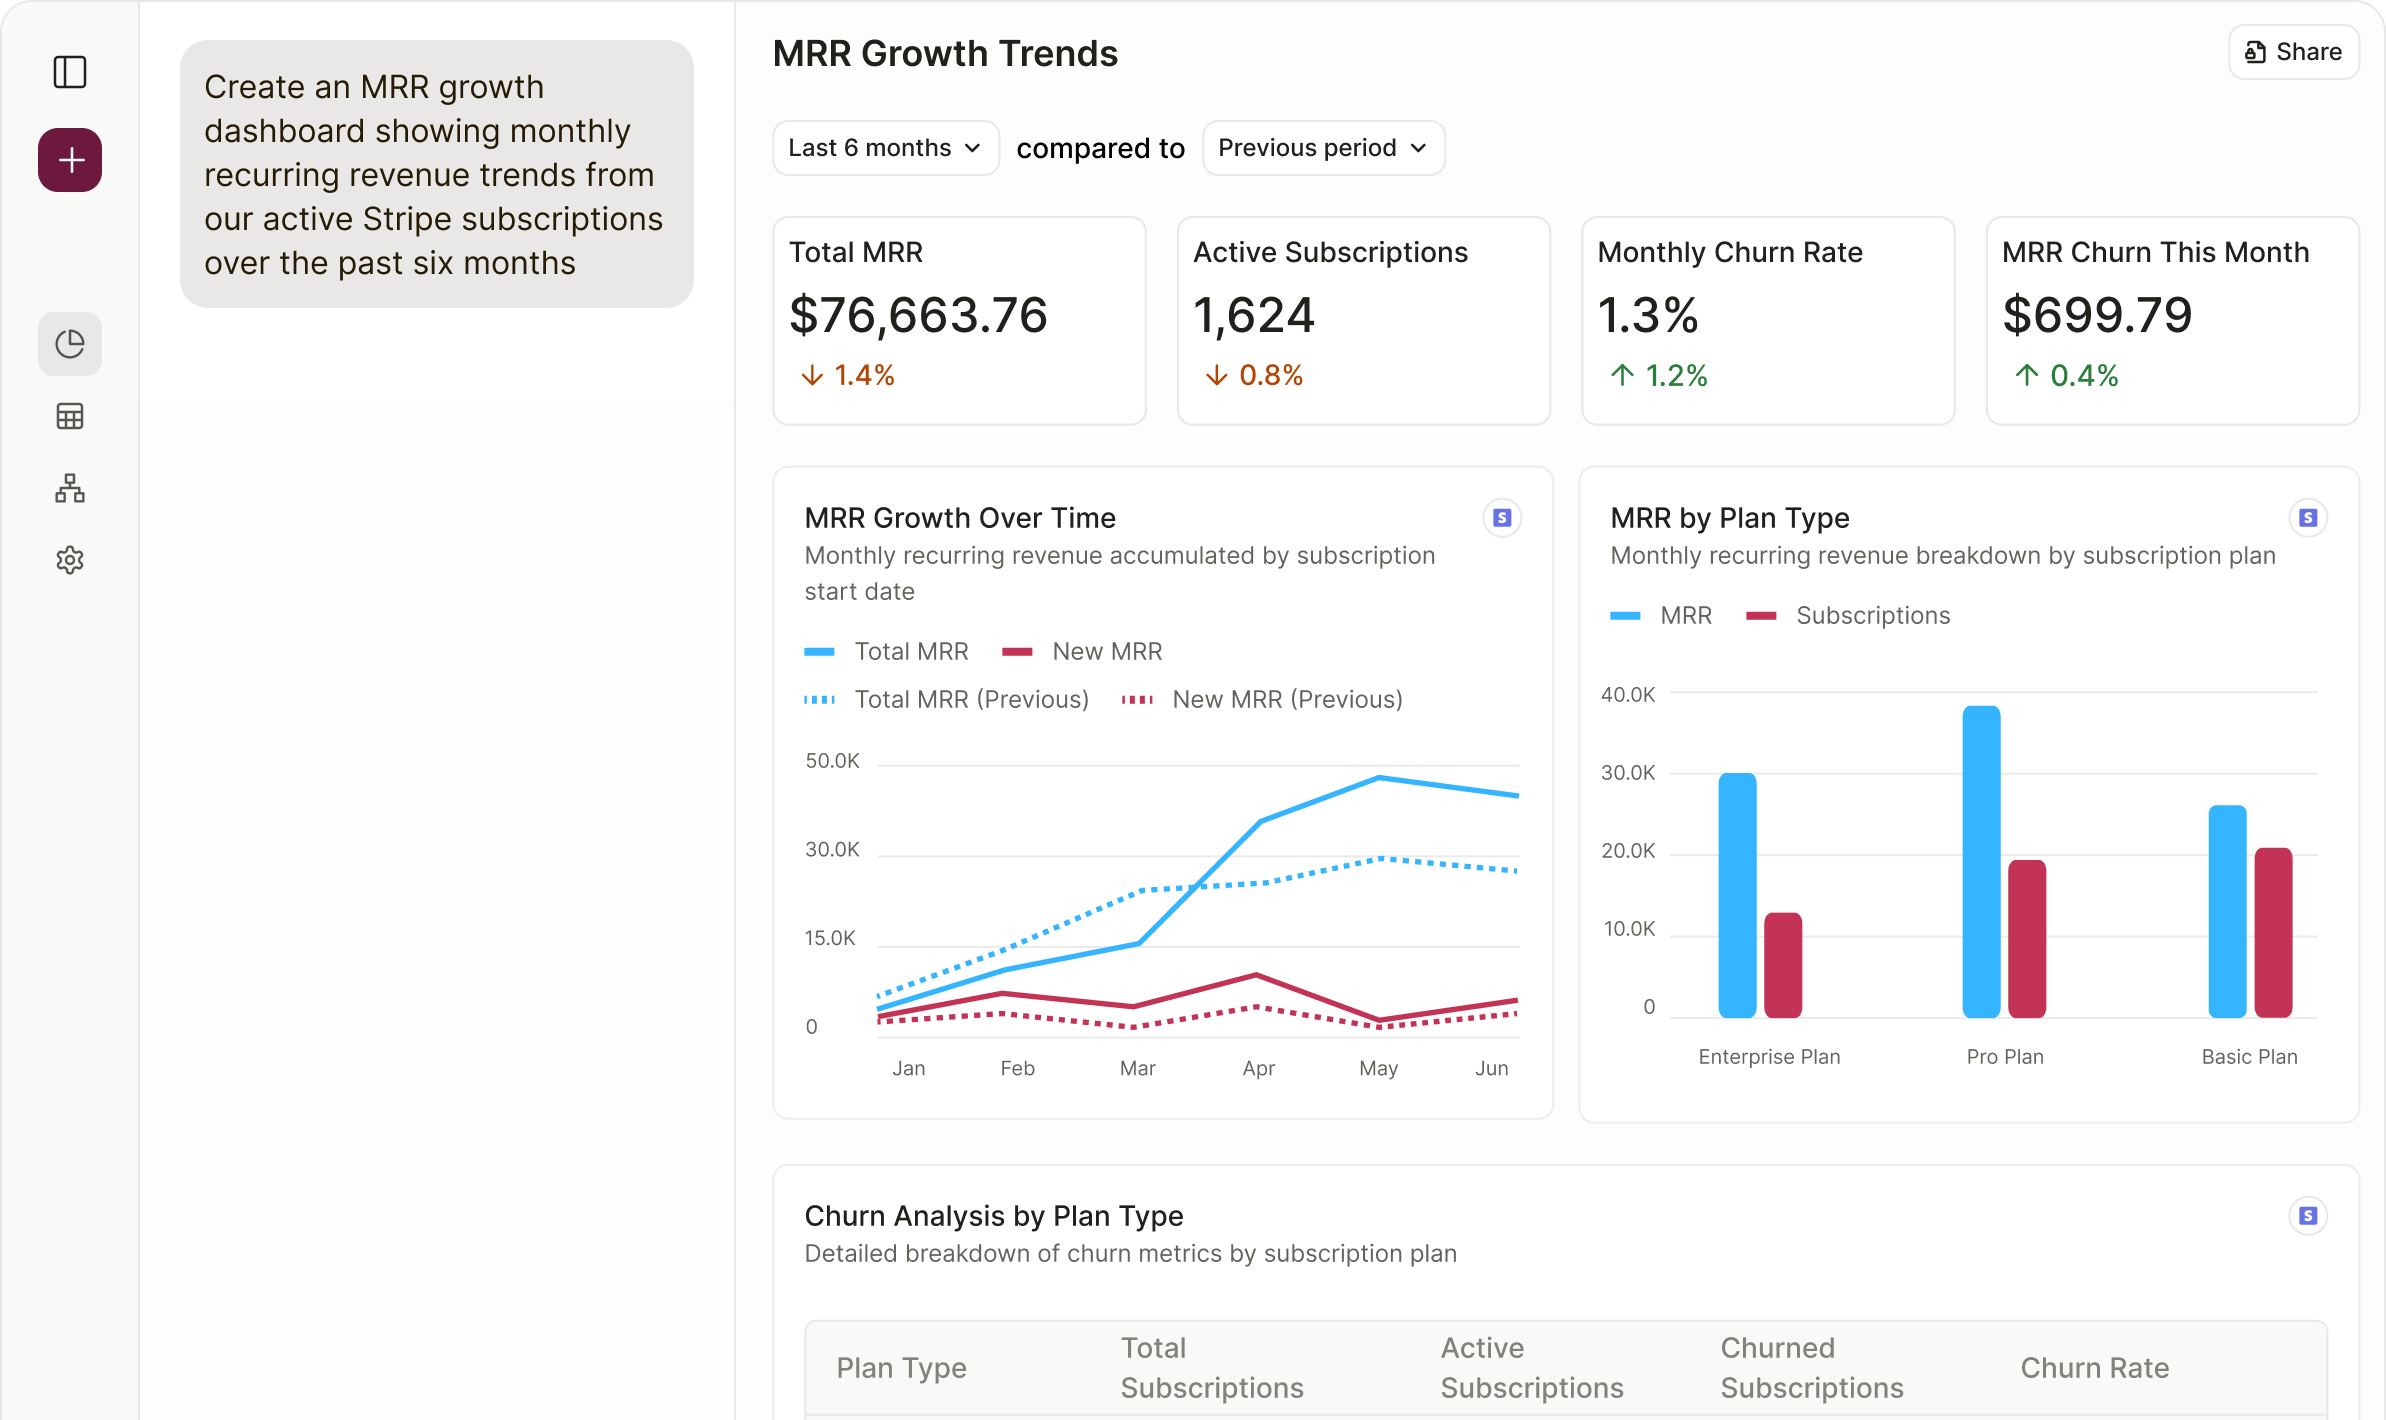
Combine Buildkite with other data sources
Your business runs on more than one app, and your analytics should too. With Filament, Buildkite lives side-by-side with sales, finance, and customer tools. Bring it all together in one intelligent workspace and finally see the full picture.


Your Buildkite data gets even more powerful when combined with other tools:
Buildkite + Jira
Connect Buildkite build data with Jira issue tracking to see which tickets trigger the most failed builds, how deployment frequency affects sprint velocity, or which teams have the longest build times.
Buildkite + GitHub
Connect Buildkite pipeline performance with GitHub repository activity to analyze which branches have the highest failure rates, how commit frequency affects build times, or which contributors trigger the most rebuilds.
Buildkite + PagerDuty
Connect Buildkite build success rates with PagerDuty incident data to see how CI/CD failures correlate with production incidents, which pipelines cause the most alerts, or how deployment frequency affects system stability.
Benefits of Filament's Buildkite Integration
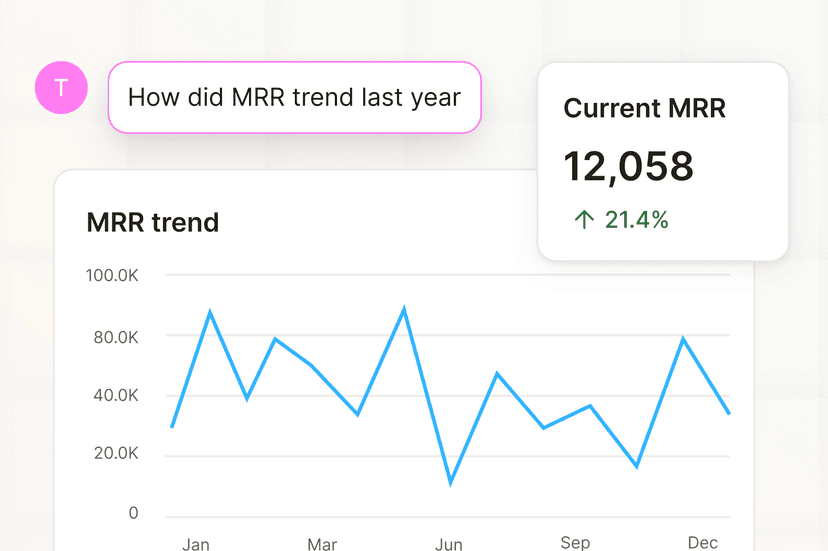
Ask in plain English
Start with a question like 'How did MRR trend last year?' and you'll get an instant dashboard from across your apps. No configuration, no code.
No setup
Filament is like Looker Studio or PowerBI, but it will set itself up. It understands your data, and automatically connects the dots.
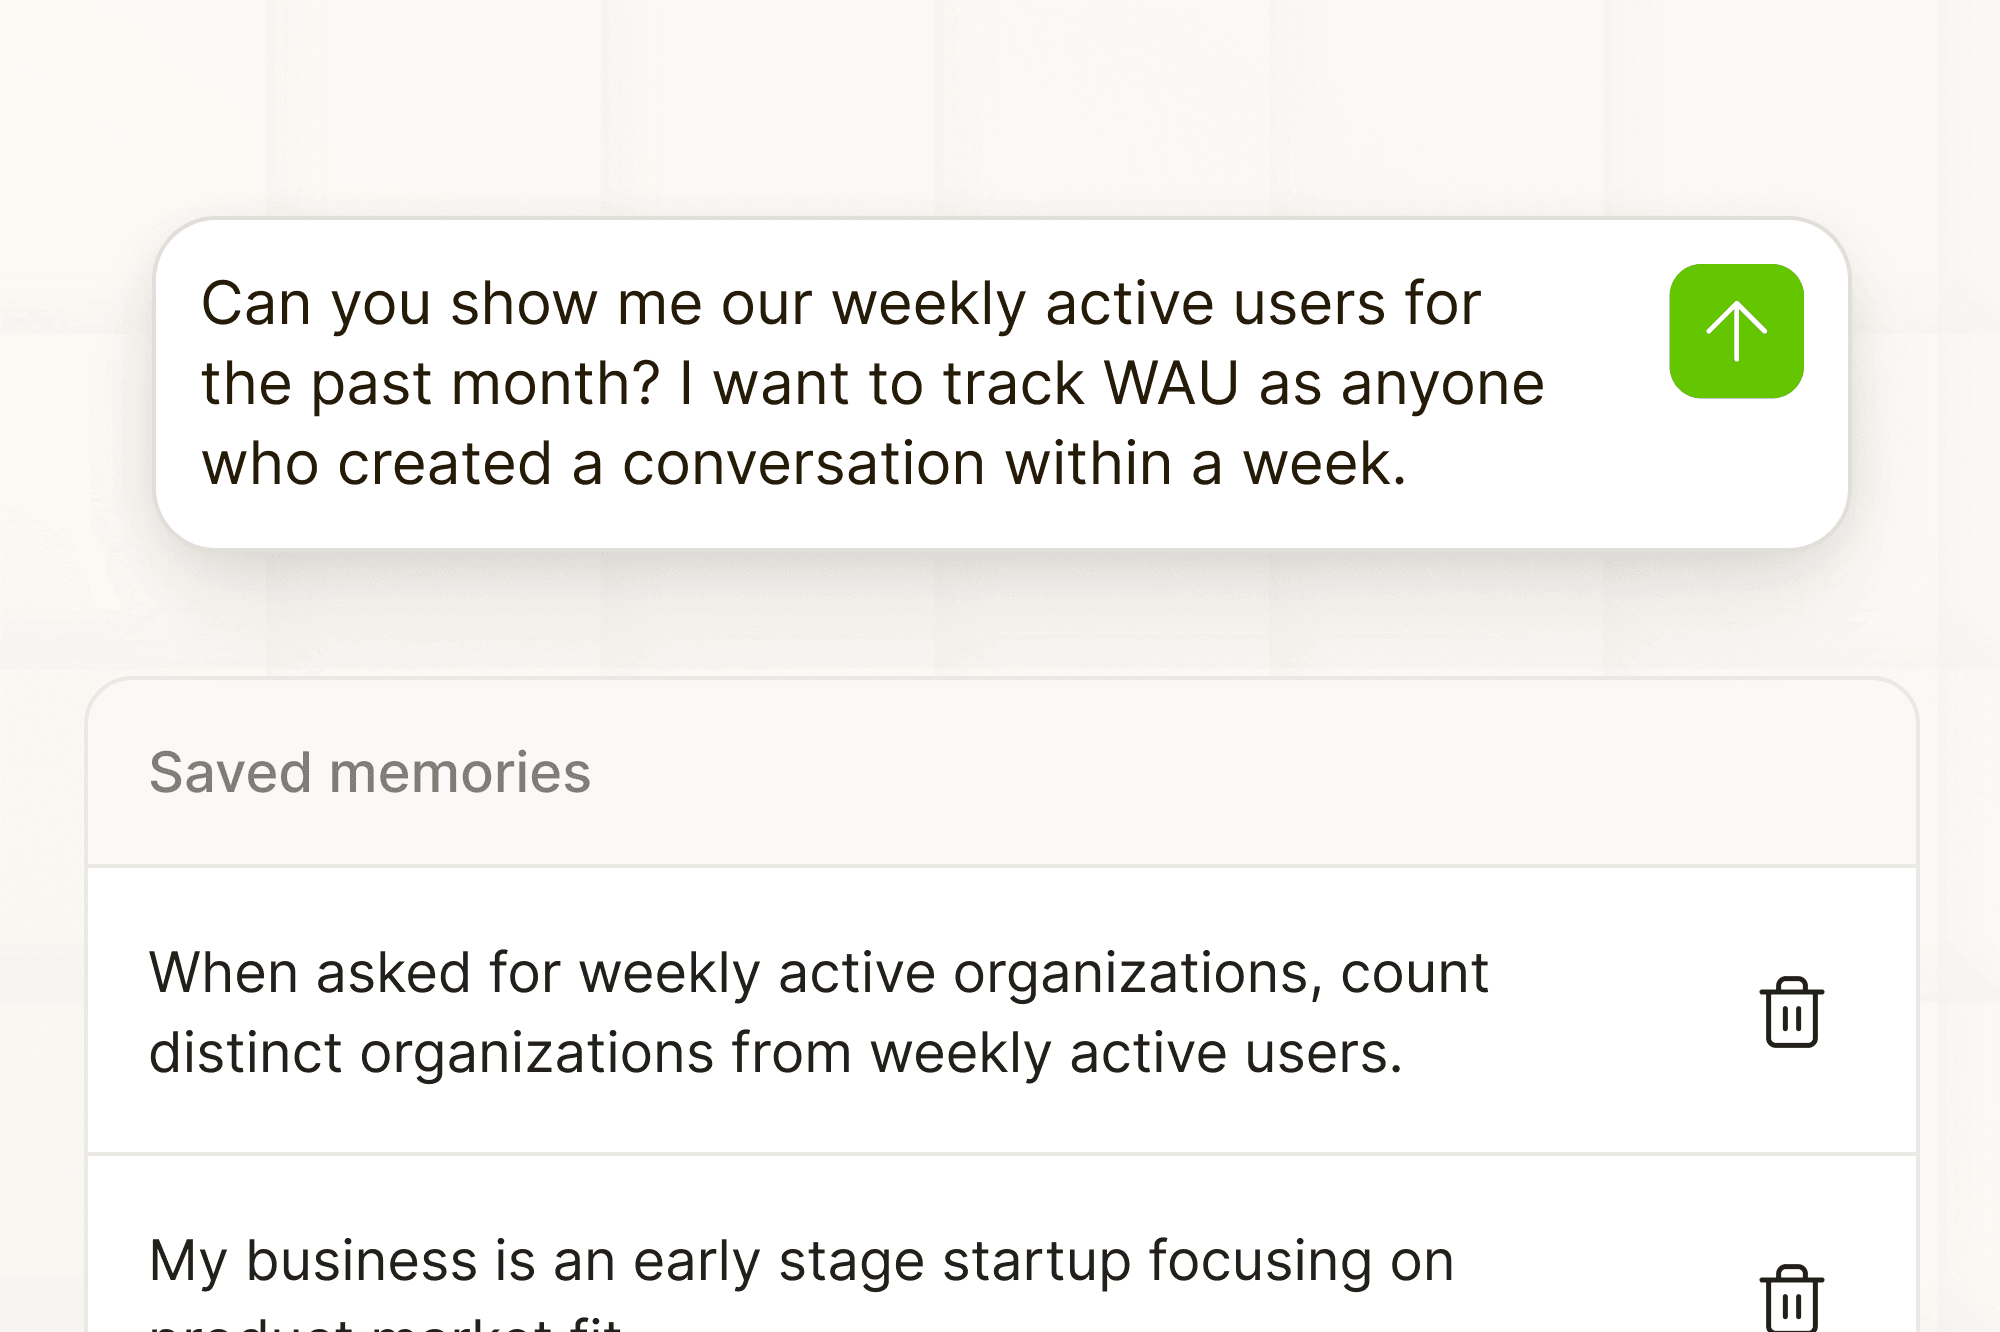
Gets smarter over time
Filament remembers your context and preferences, so you spend less time explaining and answers that align with your goals.
How it works
Step 1: Connect your Buildkite account
Connect your Buildkite account to Filament and get instant access to your data. No technical setup required.
Step 2: Ask questions about your Buildkite data
Start asking questions like "Which campaigns drive the most qualified leads?"
Step 3: Build Buildkite dashboards in minutes
Get tailored insights instantly and share them with your team.
Better business decisions with AI Analytics
How to get more from your data
Most teams only scratch the surface of what's possible with their data. Reports get buried in dashboards, exports pile up in spreadsheets, and critical insights never reach decision-makers. Filament changes that.
With Filament, your data is analyzed by a built-in analyst that understands plain English. Instead of struggling with complex tools or waiting for reports, you can instantly ask questions about revenue, marketing performance, customer engagement, or retention, and get clear answers in seconds.
Because Filament connects data across marketing, product, CRM, and finance systems, it helps you answer the bigger questions that traditional dashboards can't:
- Which campaigns and channels actually drive revenue growth?
- How does user engagement translate into pipeline or sales performance?
- Where are we losing efficiency between acquisition, retention, and finance?
By combining instant reporting, conversational dashboards, and cross-platform integration, Filament helps you move beyond surface-level metrics and uncover the insights that drive smarter, faster decisions.
Enterprise-grade security
Complete data isolation, data encryption at rest and in-transit, and secure, accredited cloud providers keep your organization's data protected. We never use your data for AI training or share it with third parties.
Learn more about securityBuildkite integration FAQ
Everything you need to know about connecting Buildkite with Filament and getting the most out of your data.